


Creative Direction + Design
Google Brand Studio 2016
_
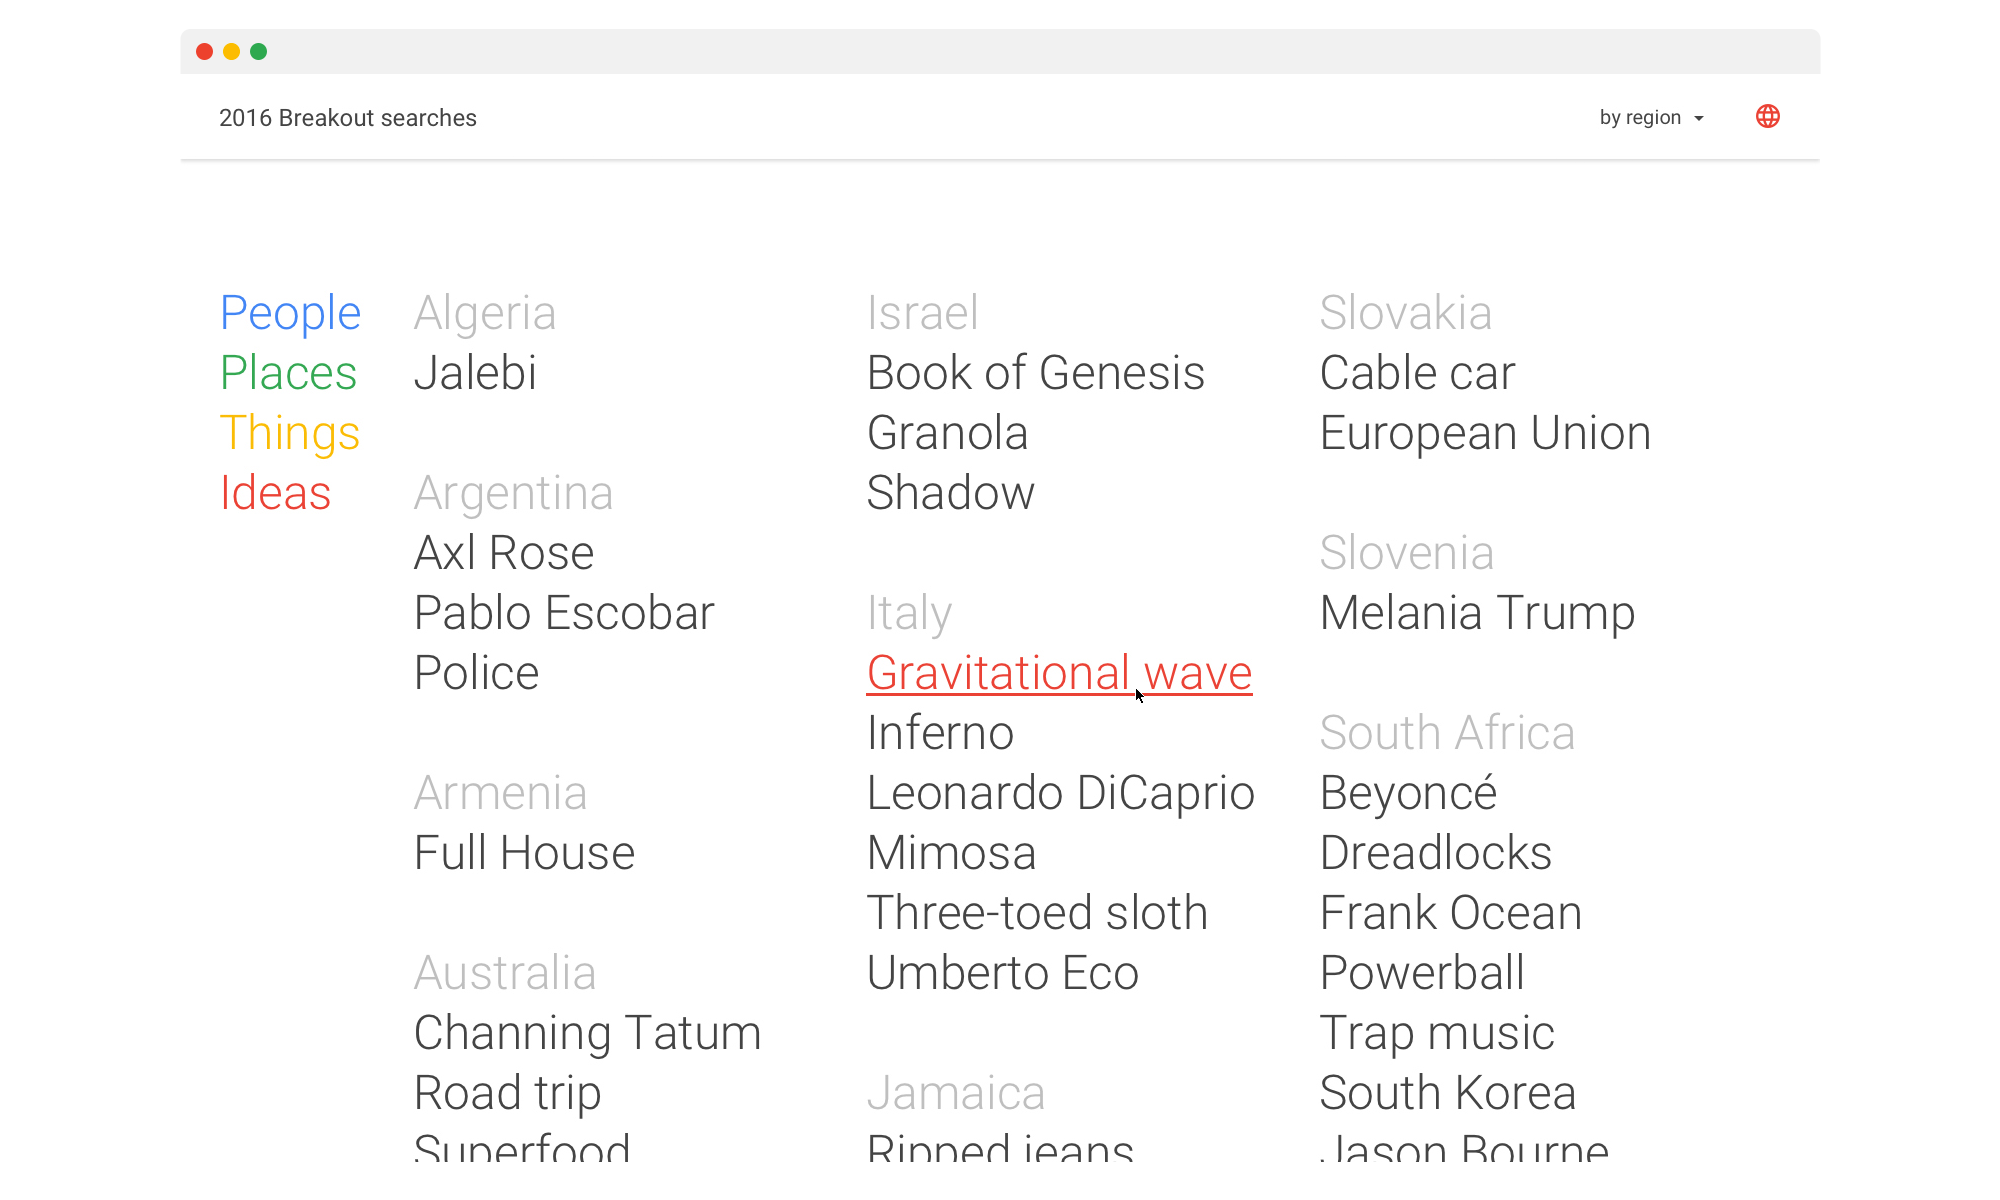
As part of Google's annual Year in Search project, we created an interactive data visualization for 2016's breakout searches — 365 terms that reached an all-time high in search interest that year. Results can be filtered by people, places, ideas, or things, and sorted by month, region, and max search interest. Terms can also be explored on a map of the world, to quickly see what was big where.
The experience had over a million visitors, with an average engagement time of 2:41. In addition to being featured on Mashable, Wired and as a FastCo Infographic of the Day, it was also shortlisted for a 2016 Cannes Lion in the "Digital Craft—Data Storytelling" category.